Why PE Portfolio Reporting Stays Broken (And How to Fix It)
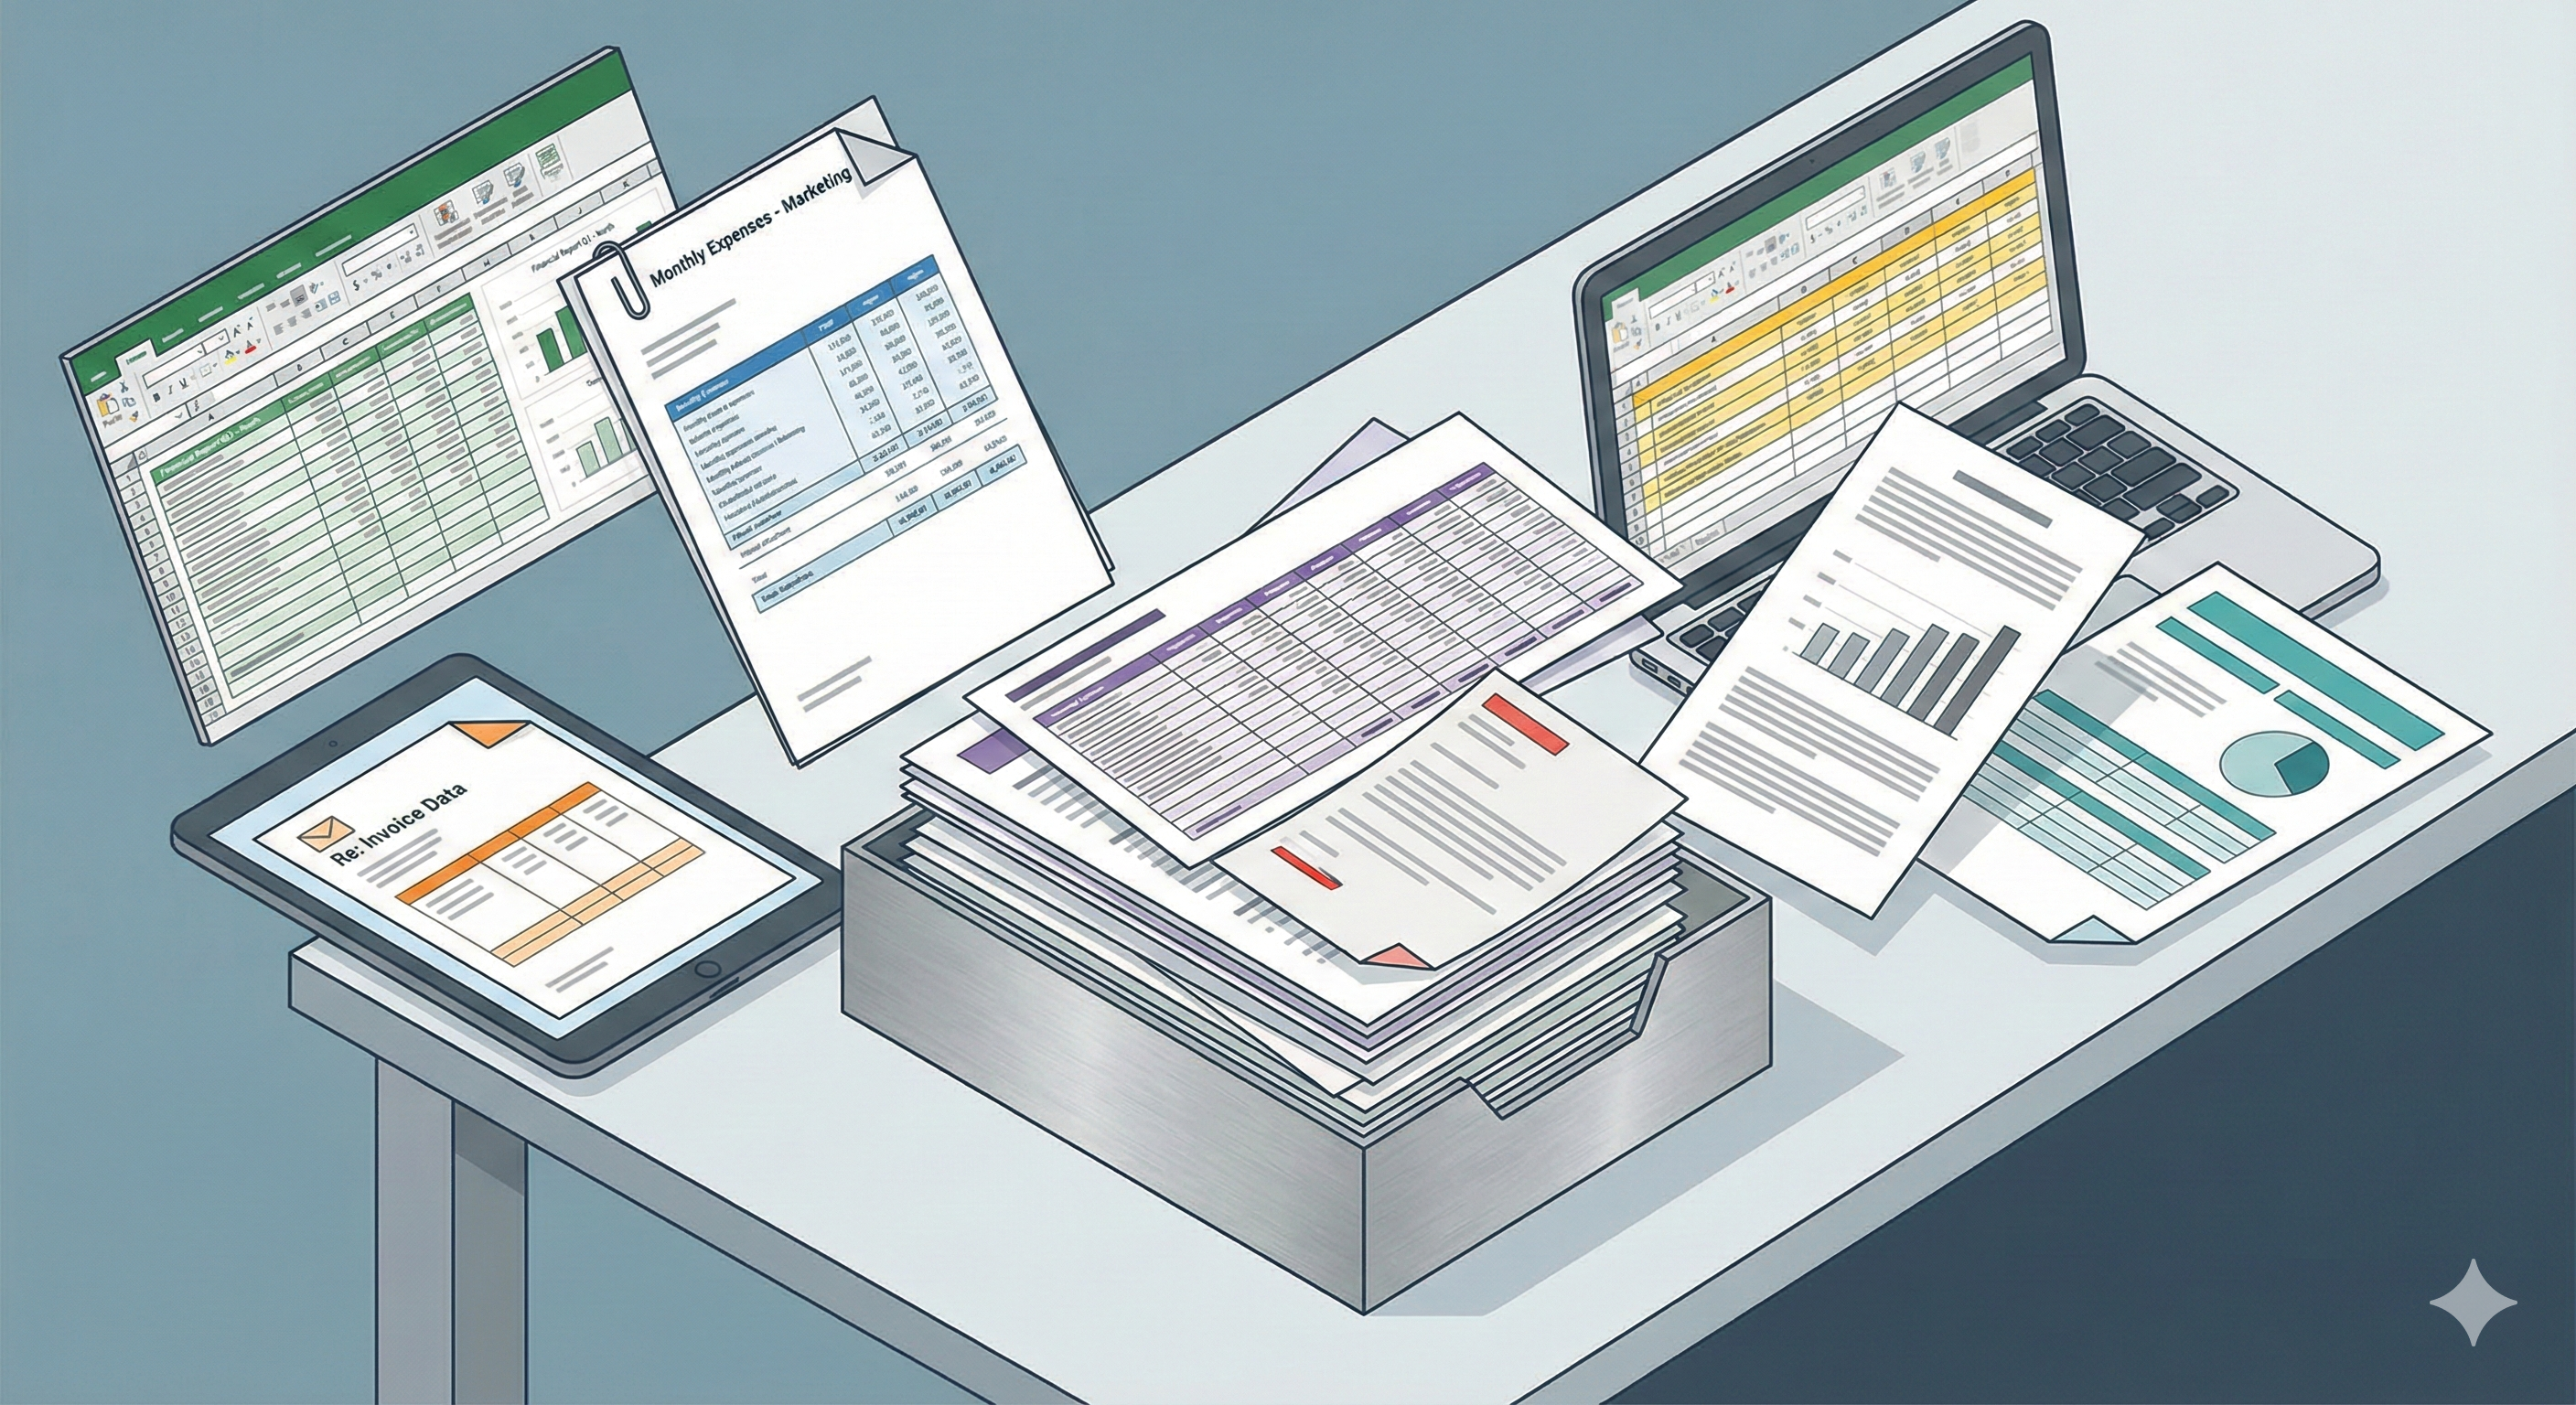
You run a PE fund with eight portfolio companies. Each month, you get eight different formats, eight different definitions of “revenue,” and eight headaches. You’ve tried templates. You’ve tried calls. Nothing sticks.
Your associates are spending twenty hours a month on what should be a two-hour task: pulling data from six different platforms, normalizing formats, and building the same monthly report by hand. That’s $100K+ in salary-equivalent being spent on copy-paste work instead of value creation.
This isn’t a technology problem. There are tools. It’s not a willingness problem either—your portcos will comply if you tell them what to do. The problem is that nobody has defined exactly what data to collect, in what format, at what frequency, with what definitions—and enforced it consistently.
Portfolio monitoring is a consulting problem disguised as a software problem.
Why Portco Reporting Is Broken
Every PE fund between $50M and $1B AUM hits the same wall. The pain doesn’t scale down with fund size—it actually gets worse. At $100M AUM with eight portcos, you’re basically running those businesses yourself. The last thing you have bandwidth for is data janitor work.
Here’s what’s actually causing the chaos:
No Shared Definitions
“Revenue” means different things at different portfolio companies. One reports booked revenue. Another reports collected revenue. A third reports recognized revenue under their specific accounting treatment. You’re comparing apples to oranges to something that might be a fruit but nobody’s sure.
EBITDA adjustments vary wildly. Headcount may or may not include contractors, temps, and seasonal workers. Without shared definitions, comparing portcos is impossible—and your consolidated reporting is fiction.
Different Source Systems
Each portfolio company uses a different ERP or accounting system. NetSuite here, QuickBooks there, Sage over there, maybe some SAP legacy system you inherited with an acquisition. You’re pulling data from six different platforms and trying to make it coherent.
Forcing ERP convergence post-acquisition is usually a non-starter. The companies are deeply engrained within their respective platforms, and the disruption cost of migration rarely justifies the reporting benefit—at least not in the short term.
The data exists. It’s just trapped in incompatible formats.
No Reporting Muscle at the Portco Level
Most $10M-$50M companies don’t have a dedicated FP&A function. The CFO—or controller, or bookkeeper—is doing PE reporting on top of their day job. Sometimes it’s the CEO handling it personally because there’s nobody else.
Reporting to the fund is seen as overhead, not value-add. So it gets deprioritized. Late submissions, inconsistent quality, missing commentary. The portco team is focused on running the business, not building pretty reports for their investors.
Fund-Level Bandwidth Constraints
At $100M AUM with eight portfolio companies, your team is small—three to five people. Time allocated to monitoring competes directly with deal sourcing. You want to be finding the next investment, not chasing down last month’s numbers.
The associates who built the model to close the deal are now copy-pasting monthly reports. They’re getting paid to do analysis, but they’re spending their time on data collection and format normalization. It’s a mess setting this up, and nobody has time to fix it properly.
The Standard Software Answers (And Why They Fall Short)
Ask around and you’ll hear the same recommendations. iLevel, Chronograph, Cobalt. These are purpose-built PE portfolio monitoring platforms that solve real problems—for funds large enough to justify them.
At $500M+ AUM with dedicated operations staff, these platforms make sense. You have the headcount to manage the implementation, the volume to justify the cost, and the organizational discipline to enforce compliance. iLevel (S&P Global), Chronograph, and Cobalt (FactSet) offer robust data collection workflows, standardized KPI tracking, and LP reporting automation.
At $100M AUM? You’re too small for enterprise portco reporting tools but too big to run everything through monthly phone calls. The implementation effort for these platforms is substantial—iLevel implementations typically run two to five months with dedicated consulting support. And you’ll still face the fundamental problem: getting each portco’s ERP integrated into whatever system you choose.
Some firms explore general-purpose FP&A platforms like Anaplan, Workday Adaptive Planning, or OneStream. These can technically handle consolidated reporting, but they’re designed for corporate financial planning, not PE-specific workflows. The data collection templates, portco benchmarking, and LP reporting features that make purpose-built PE tools valuable are missing—and you’ll pay enterprise pricing for capabilities you don’t need.
The tools aren’t the constraint. Standardization is. It’s the same reason PE’s Day 1 playbook breaks down—operational complexity can’t be solved by buying software.
What Actually Works: Standardize the Ask, Not the Source
You don’t need to force all your portcos onto the same ERP. You need to force them onto the same reporting standard.
The difference is crucial. Standardizing the source means migration projects, change management, implementation costs, and organizational resistance. Standardizing the ask means defining what you need, in what format, and holding portcos accountable for delivering it.
Here’s the framework that works at the $100M-$500M AUM level:
Step 1: Define the Template
Create a single, non-negotiable monthly reporting package. Eight to twelve KPIs that every portfolio company reports, regardless of industry.
Not industry-specific metrics—those come later. Start with the universal measures that let you compare portco performance across your portfolio:
Financial Baseline:
- Revenue (with explicit definition: recognized, collected, or booked)
- Gross margin (with explicit cost allocation methodology)
- EBITDA (with standardized add-back categories)
- Cash position (ending balance, not average)
Operational Health:
- Headcount (full-time equivalents, defined)
- Revenue per employee
- AR aging (30/60/90+ buckets)
- AP aging (current obligations)
Forward Indicators:
- Backlog or pipeline (if applicable)
- Customer concentration (top 5)
- Working capital trend
Write down the exact definitions. Not “revenue”—“revenue recognized under GAAP in the reporting month, excluding non-recurring items as defined in the addback schedule.” Make it impossible to interpret differently.
Step 2: Tier the Frequency
Not everything needs to be monthly. Some metrics need to be weekly. Others can be quarterly. Matching frequency to decision relevance reduces the reporting burden without sacrificing visibility.
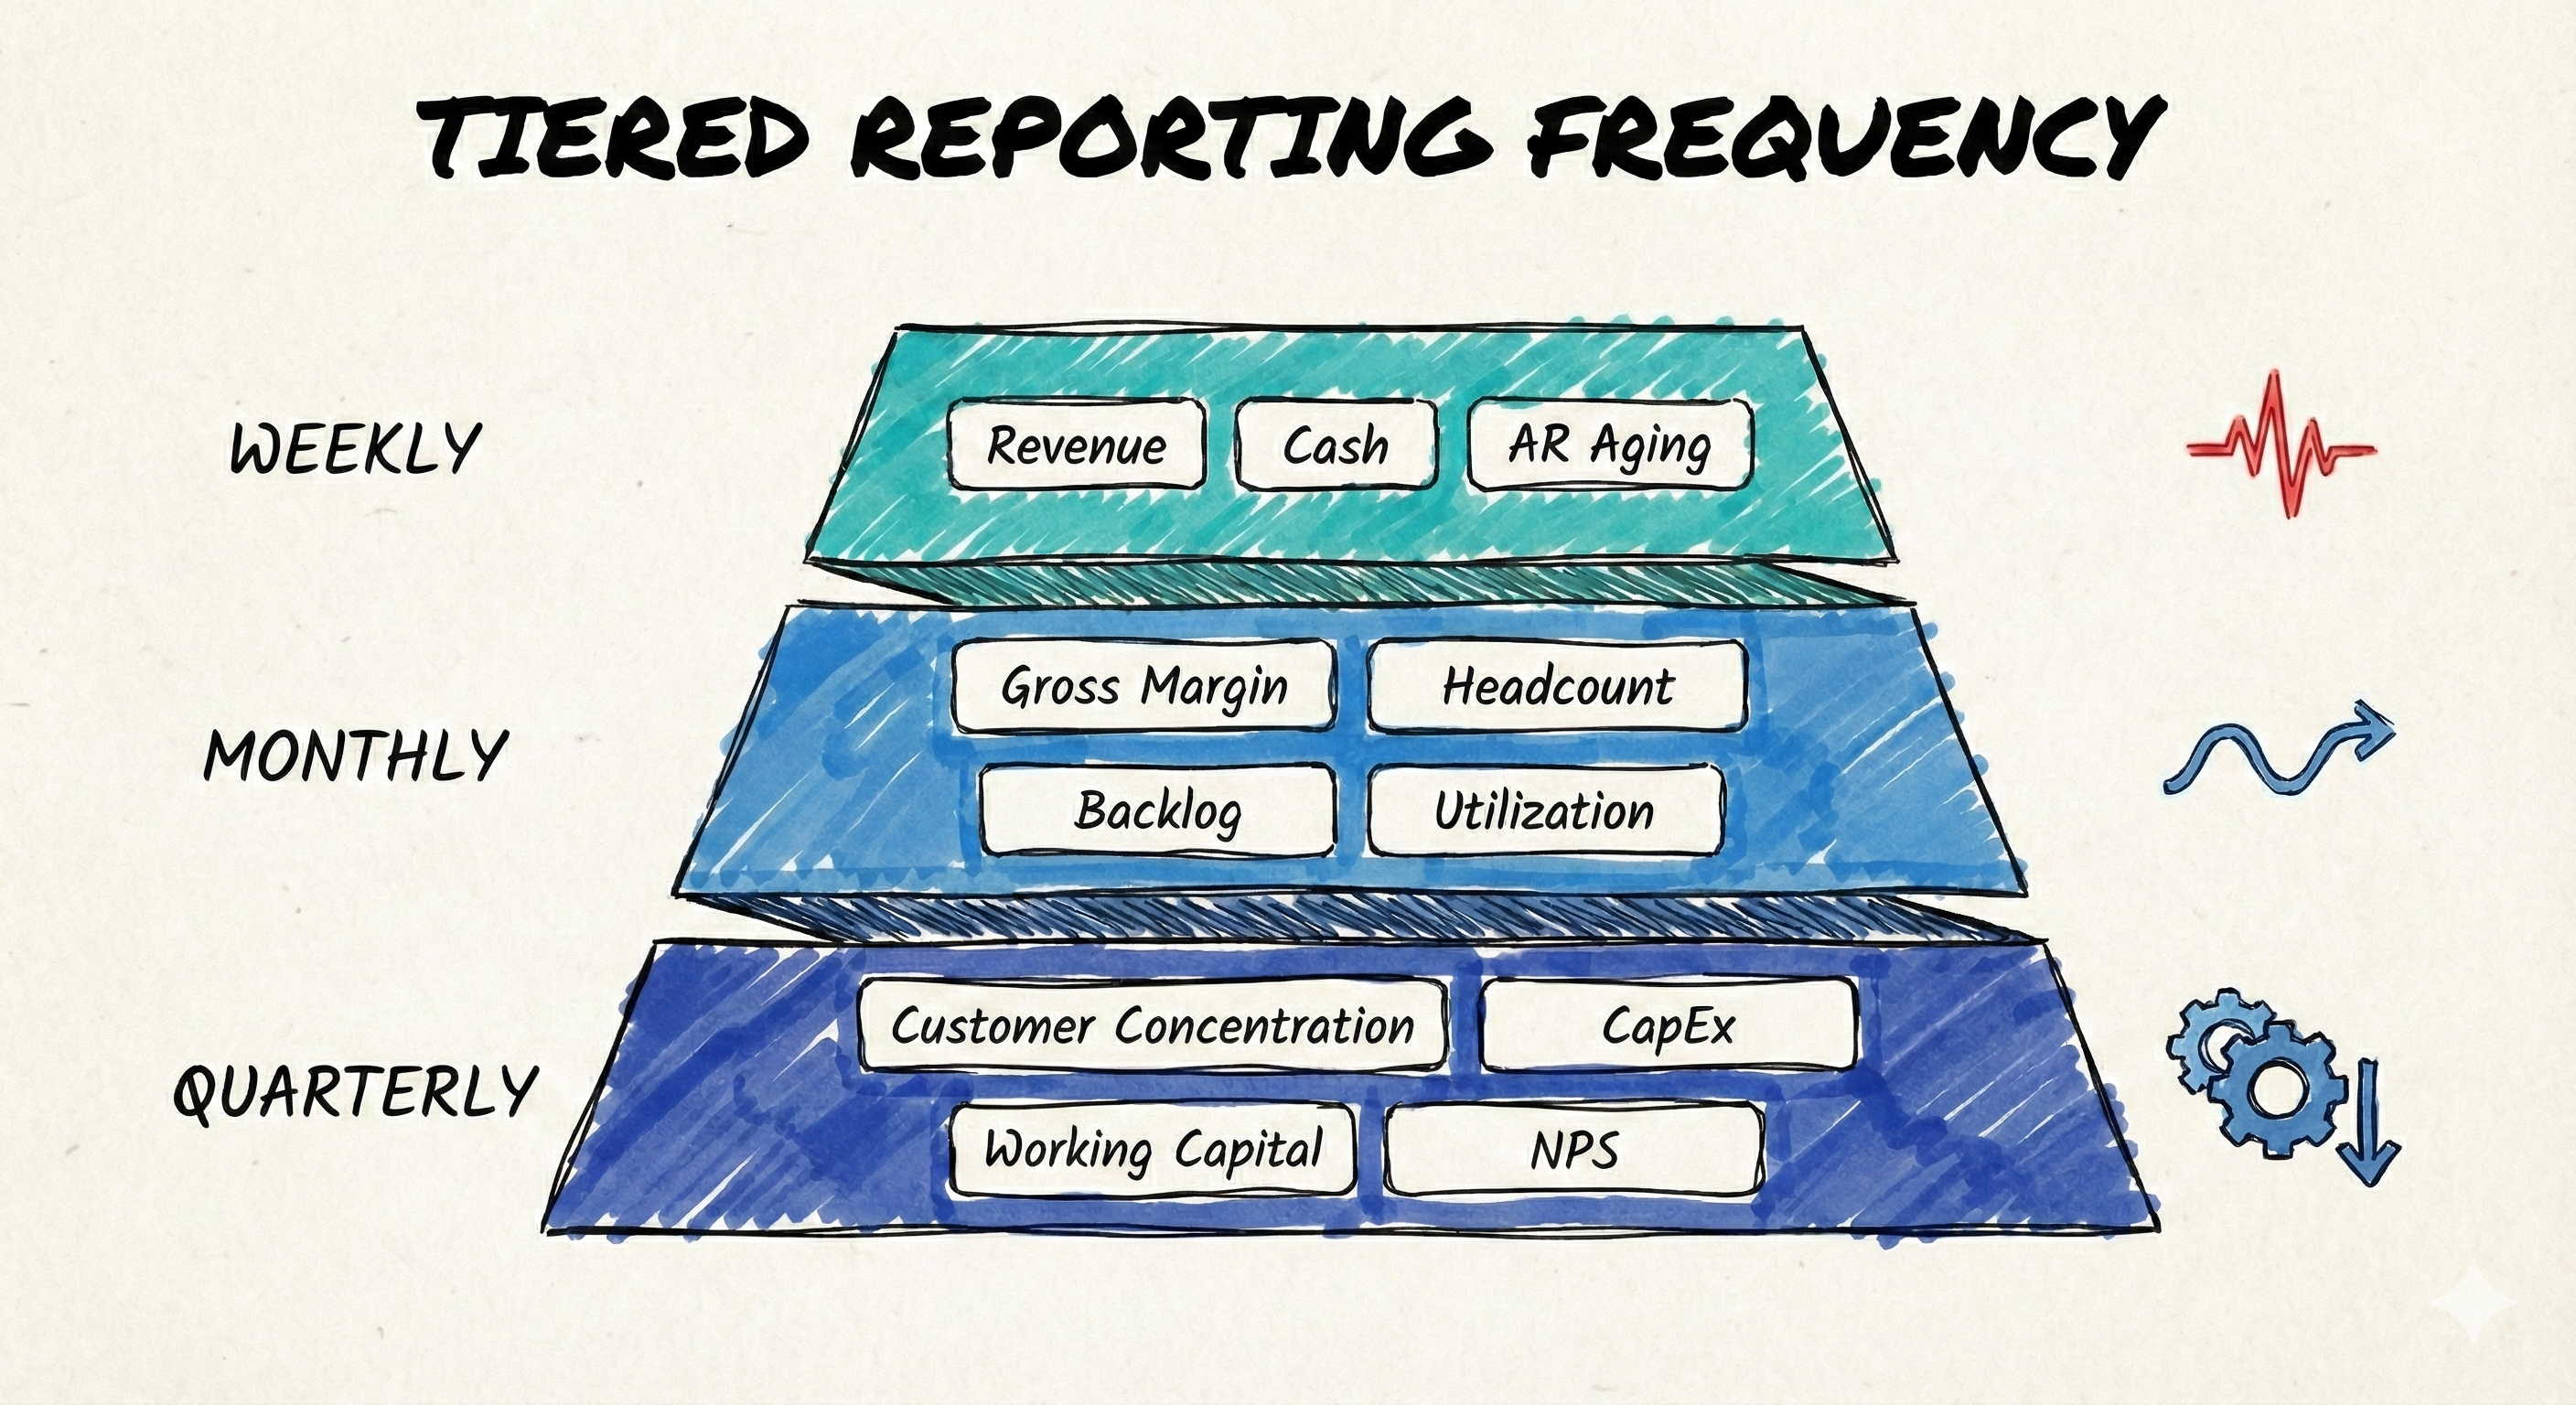
The weekly flash takes ten minutes to produce once the process is established. It keeps you informed without drowning anyone in reporting work. The monthly package is your core decision-making dataset. The quarterly strategic view lets you step back and evaluate trajectory.
Step 3: Build the Extraction
Don’t force ERP migration. Build exports from existing systems instead.
Map each portco’s chart of accounts to your standard template. This is a one-time setup effort—usually two to four hours per company with someone who understands both their system and your requirements.
Automate where possible. Most ERPs can produce scheduled exports. Some can push directly to a shared location. For the holdouts, a structured spreadsheet with locked cells and validation rules prevents creative interpretation.
The goal isn’t real-time integration. The goal is consistent, reliable, comparable data delivered on a predictable schedule. Real-time visibility is nice, but standardized monthly data is better than chaotic daily feeds.
Step 4: Enforce the Standard
This is where most funds fail.
You define the template. You build the extraction. You send it to your portcos with instructions. And then… submissions trickle in. Some are late. Some are incomplete. Some interpret the definitions creatively. By the time you’ve chased everyone down and normalized the data, you’ve spent more time than the old manual process.
The standard only works if someone enforces it consistently.
First 90 days: Hands-on support. Help each portco build their report the first few times. Sit with their CFO or controller. Identify where their systems don’t easily produce what you need and solve those problems together.
Months 3-6: Shift to self-service. The portco owns the process. You review submissions for accuracy and completeness but don’t do the work for them.
Ongoing: Review quality monthly. Flag inconsistencies immediately. Don’t let it slide for one month because next month will be worse. The five minutes you save by not following up today costs you five hours next quarter.
Enforcement isn’t about being difficult. It’s about making the standard stick. If exceptions become normal, you’re back to seven formats.
Step 5: Make It Insightful, Not Just Data
The difference between a data dump and a performance report is commentary.
Raw numbers without context are useless for decision-making. Why did revenue drop? Is that concerning or expected? What’s the plan to address it? The portco CEO knows these answers—the monthly report should capture them.
Require three bullets with every submission: what went well, what didn’t, and what you need. Not a narrative essay. Three bullets. Takes five minutes to write. Transforms a spreadsheet into actionable intelligence.
At the fund level, build exception flagging into your review process. Any metric that moves more than 10% from prior month, budget, or benchmark gets highlighted automatically. You shouldn’t have to hunt for problems—they should surface themselves.
The consolidated view should be a traffic light summary: green, yellow, red across all portcos on the metrics that matter. Your Monday morning should start with a single page that tells you where to focus, not a stack of spreadsheets to decode.
The Time Math
Before standardization, your associates spend fifteen to twenty hours per month consolidating data across eight portfolio companies. After standardization, that drops to two to four hours reviewing submissions plus one hour of exception handling.
That’s eighty-plus hours per month freed for value creation work instead of data janitor work. Across a year, you’re reclaiming the equivalent of a half-time analyst.
The setup cost is thirty to sixty days of focused effort: defining standards, building extractions, training portcos, and establishing the enforcement rhythm. After that, the system runs itself with minimal oversight.
The ROI is obvious once you do the math. The question is whether you’ll invest the upfront effort to capture it.
The Real Problem
Portfolio monitoring isn’t a software problem. It’s a standards problem. And until you solve it, everything downstream—from AI strategy to advanced analytics—is built on sand.
Every fund knows this. Few funds fix it. The implementation effort feels like a distraction from the “real work” of finding and improving investments. So associates keep copy-pasting, CFOs keep sending whatever format is easiest, and partners keep complaining that they don’t have visibility.
The fund that solves this first gets eighty hours per month back for value creation. The fund that doesn’t keeps paying associates to do work that shouldn’t exist.
The question isn’t whether you need standardized portco reporting. You know you do. The question is whether you’re willing to build it yourself, hire someone to build it for you, or keep muddling through with semi-standardized data that takes effort every month to interpret.
The pain is real. The solution is known. The only variable is who does the work.
Alex Escoriaza helps PE funds and portfolio companies turn messy data into operational clarity. Dealing with the eight-formats problem? Reach out—this is exactly the kind of project I take on.