Beyond the Spreadsheets: What PE's Day One Playbook Gets Wrong About Operations

You acquired a manufacturing company. You have the P&L, the balance sheet, and a financial model with fifty tabs. The quality of earnings report came back clean. The deal team is celebrating.
Now tell me: which production line is your bottleneck?
You can’t. Because you cannot run a business from the financial statements—especially not a manufacturing or services business where operational complexity lives in places a spreadsheet will never show you.
This is the gap that destroys post-close value creation plans. And it’s happening at nearly every PE-backed acquisition in the lower middle market.
The Financial Data Trap
Private equity has professionalized the acquisition process. Quality of earnings validates the numbers. Commercial due diligence validates the market. Legal reviews the contracts. Tax structures the deal.
But here’s what none of that tells you:
Where the actual bottlenecks are. The P&L shows margin compression. It doesn’t tell you whether that’s a pricing problem, a utilization problem, or a waste problem. Those require completely different fixes.
Which processes are fragile. Financial statements aggregate everything into tidy line items. They can’t show you that three critical processes depend entirely on one technician who’s been there for twenty years and has no backup.
Who actually knows how things work. The org chart says one thing. The reality of who holds tribal knowledge, customer relationships, and operational expertise says something else entirely. That information isn’t in any data room.
Whether the business can execute the growth model. Your financial projections assume capacity that may or may not exist. The deal team built a model showing 40% revenue growth. Did anyone validate that the factory floor can actually produce 40% more?
The pattern is predictable: financial DD confirms the numbers, the deal closes, and then the operating team arrives to discover that none of those tabs tell you how the business actually runs.
As one PE professional put it bluntly: “Too many finance deal guys don’t actually know anything about real business or operations besides what exists in a spreadsheet, Word doc, or PowerPoint.”
That’s not a criticism. It’s a structural reality. Deal teams are optimized to close deals. They’re not equipped to diagnose operations.
What “Beyond the Spreadsheets” Actually Means
When experienced operators talk about moving beyond the spreadsheets to find the real bottlenecks on the factory or warehouse floor, they’re describing a fundamentally different data set than what closed the deal.
Management accounting, not financial accounting. Financial accounting tells you total COGS. Management accounting tells you cost per unit, cost per production line, cost per customer. The first satisfies auditors. The second drives decisions.
Process observation, not process documentation. Every company has documented processes somewhere. Almost none of them match reality. The best operators get their butts on the floor, observe, and talk to employees and customers. What’s actually happening is rarely what’s written down.
Operational KPIs, not financial KPIs. Revenue and EBITDA are lagging indicators—they tell you what already happened. Operational metrics like utilization, throughput, cycle time, yield, and on-time delivery are leading indicators. They tell you what’s about to happen to your financials.
Here’s why this matters for value creation: if you implement operational improvements and efficiency gains, your financials might actually look worse in the short term. Severance costs. Implementation expenses. Temporary productivity dips during transitions.
Without operational KPIs, you won’t know if you’re winning or losing until it’s too late. You need visibility into the leading indicators that prove your changes are working—even when the P&L hasn’t caught up yet.
The human signal. Who actually knows how things work? It’s rarely reflected in the org chart—and it’s almost never captured in any system. The people closest to the work hold knowledge that no data room contains.
Financial due diligence can’t see any of this. It’s not designed to.
The Day One Operational Diagnosis Framework
The instinct after closing is to start optimizing. Resist it.
You don’t know enough yet to optimize anything. What looks like an obvious inefficiency might be a workaround for a deeper problem you haven’t discovered. The “low-hanging fruit” your deal team identified might be load-bearing.
Before you change anything, you need ground truth on operational performance. Here’s how to get it:
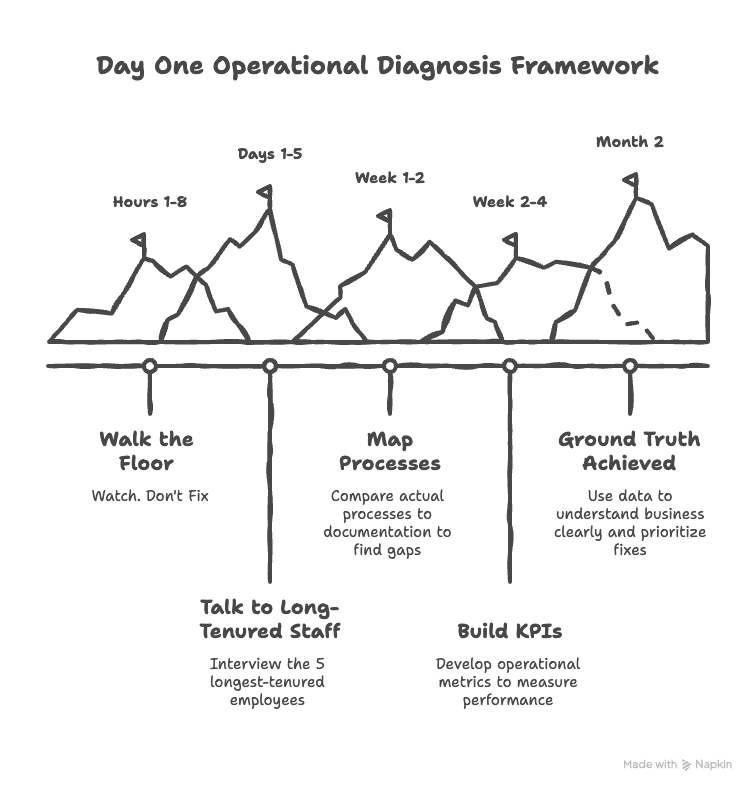
Hours 1-8: Walk the Floor
Don’t touch anything. Don’t suggest anything. Just observe.
Watch how work actually flows. Where do things pile up? Where do people wait? Where do you see workarounds—sticky notes, manual tracking sheets, people walking information from one station to another?
Pay attention to what isn’t happening as much as what is. If a machine sits idle, why? If a bay is empty, why? If someone is doing something manually that should be automated, why hasn’t it been?
Your job in the first day isn’t to fix problems. It’s to see them clearly.
Days 1-5: Talk to the Five Longest-Tenured People
Not management. The people who’ve been doing the actual work the longest.
Ask them: “What breaks?” “What would you fix if you could?” “What did the previous owner never understand about how this place actually runs?”
These conversations will surface more actionable intelligence than any management presentation. The people closest to the work know where the real problems are. They’ve been waiting for someone to ask.
Week 1-2: Map Actual Processes vs. Described Processes
Take whatever process documentation exists—SOPs, workflow diagrams, system descriptions—and compare them to what you observed.
The gaps are your roadmap. Where reality diverges from documentation, you’ve found either a training problem, a system problem, or a documentation problem. Each requires a different response.
Don’t assume the documentation is right and the floor is wrong. Usually it’s the opposite.
Week 2-4: Build 5 Operational KPIs
Now you have enough context to know what to measure. Build a small set of operational metrics that the financial model can’t see:
For manufacturing:
- OEE (Overall Equipment Effectiveness) by line
- Scrap and rework rate
- On-time delivery percentage
- Revenue per direct labor hour
- Planned vs. unplanned downtime
For services:
- Utilization rate (billable hours vs. available hours)
- Revenue per FTE by service line
- First-time fix rate or rework rate
- Customer response time
- Labor cost as percentage of revenue by contract
For logistics and distribution:
- Revenue per truck/route/stop
- Cost per mile or cost per delivery
- Load factor and fill rate
- Driver turnover rate
- On-time performance
Track these for thirty days before changing anything. You need a baseline that reflects current reality, not current chaos during a transition. This baseline becomes the foundation for ongoing portfolio monitoring that compounds in value over the hold period.
Month 2: Now You Have Ground Truth
After thirty days of operational data, you can finally see the business clearly. Now you know which problems are real, which are symptoms of deeper issues, and which “obvious” fixes would actually create new problems.
Now you can prioritize. Not before.
The Lower Middle Market Advantage
At $5M-$40M enterprise value, you don’t have an army of consultants or a dedicated operations team at the fund level. That feels like a disadvantage, but it’s actually an opportunity.
Large PE firms rely on standardized playbooks and operating partners who oversee ten portfolio companies at once. They can’t get into the operational weeds of any single business. They manage by spreadsheet because that’s the only way to manage at scale.
At the lower middle market, you can actually see the business. You can walk every floor, talk to every key employee, understand every process. The business is small enough that ground truth is accessible—if you make the effort to get it.
The firms that treat this as a feature rather than a bug outperform. They don’t just buy businesses and apply generic “value creation” frameworks. They diagnose each business on its own terms and build operational visibility that the financial model never had.
The Cost of Skipping This
When PE firms skip operational diagnosis and jump straight to “value creation,” the pattern is consistent:
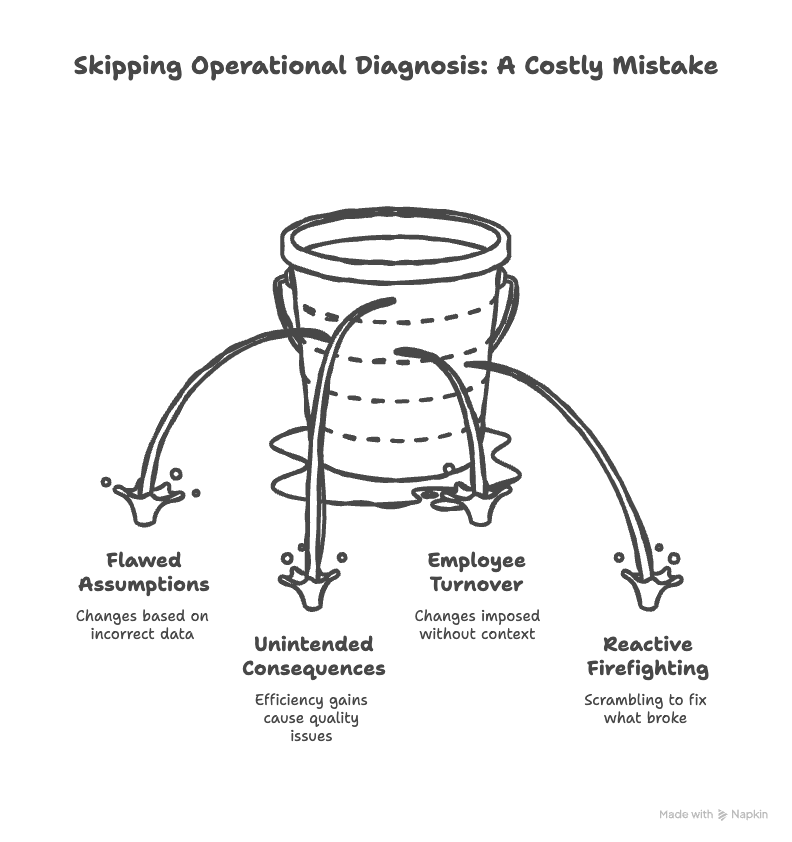
Months 1-3: Implement changes based on the financial model’s assumptions. Cut costs that looked like fat. Push for efficiency gains the deal team projected.
Months 4-6: Realize the assumptions were wrong. The “fat” was actually muscle. The efficiency gains created quality problems or customer service issues. Key people leave because changes were imposed without understanding context.
Months 7-12: Scramble to fix what broke. Bring in new management. Rebuild relationships with customers and employees. Restart the value creation clock.
Year 2: Finally have the operational visibility you should have built in Month 1. Now you can actually improve things.
That’s twelve to eighteen months of lost value creation time—on a typical five-year hold period, that’s 20-30% of your runway.
A thirty-day operational diagnosis doesn’t cost much in time or money. Skipping it costs a year or more.
The Real Question
Financial due diligence tells you what the business earned. Operational due diligence tells you if it can keep earning it—and whether it can earn more.
The deal team’s job was to answer the first question. Your job, post-close, is to answer the second.
Before you optimize anything, before you implement any value creation initiative, before you make any changes to how this business runs, answer this:
What does “good” look like for this specific business?
Not good according to a generic framework. Not good according to what worked at your last portfolio company. Good for this business, with these processes, these people, these customers, these constraints.
If you can’t answer that question from the data you have today, you’re not ready to change anything. You’re still flying blind.
The financial model got you the deal. Now you need an operational model to create the value.
Alex Escoriaza is the founder of Analytics Coaching & Consulting, helping PE-backed companies and their operators establish operational visibility during the critical post-acquisition period. Take the analytics maturity assessment to see where your portfolio company stands.